Gallery of Visualization Samples
This gallery of statsitical graphics samples is drawn from our Essential Data Science for Petroleum Geoscientists and Engineers training course. Each sample is created programmatically using Python code and real open datasets drawn from National Data Repositories.
Starting from scratch, the course develops the practical skills and mindset for exploratory data analysis. Combined with an open data science toolkit and just enough Python to get started, attendees will be equipped to start telling stories with their own data.
Interactive statistical graphics
Visualization of statistical data is more important than ever, and there's no shortage of tools for creating compelling data graphics by writing Python code: matplotlib, seaborn, Bokeh, to name but a few. Our experience is that Plotly is great choice for making statistical graphics, due to the strong support for Python, the convenience layer provided by Plotly Express, and the interactivity of the resulting figures. Another benefit for geospatial visualizations is the slick integration with Mapbox which provides the underlying cultural basemap and satellite imagery.
Let the data speak
One of the nice features of Plotly is the ability to save graphics in a form that preserves interactive features. This capability allows you to share your work with colleagues and enables them to conduct their own exploration of the data in a way that just isn't possible with a static image. By way of illustration, here's a gallery of samples drawn from our data science training course.
Click on the cards below to explore the samples. Hints on usage are given to help you get the most from the interactive features.
Microseismic data
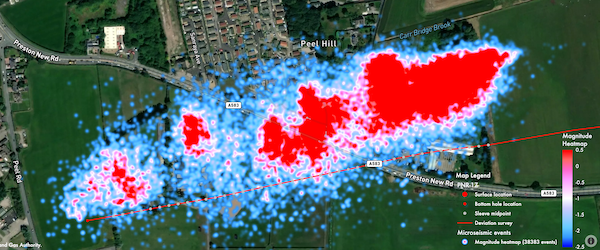
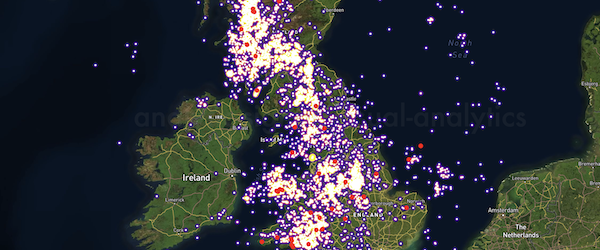
Microseismic heatmaps
Microseismic monitoring is a key technology in the development of unconventional resources, enhanced geothermal systems, and subsurface storage of CO2.
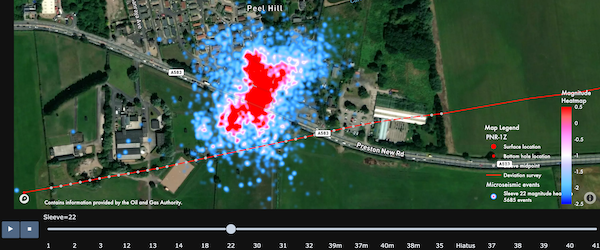
Multiresolution heatmaps are an expressive tool for interpreting dense clouds of microseismic events, revealing global patterns and local detail depending on zoom level. Weighting by magnitude clarifies the spatial distribution of energy release by encoding each pixel according to the integrated magnitude in its neighbourhood.
Animation: The video play/pause buttons control the animation or use the slider to navigate to events for a particular stage.
Production data
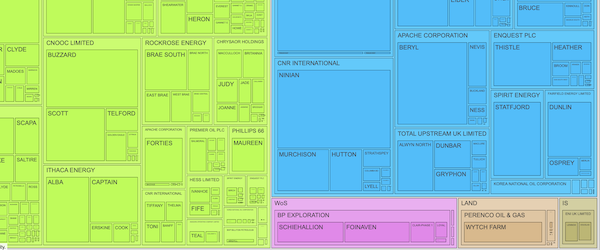
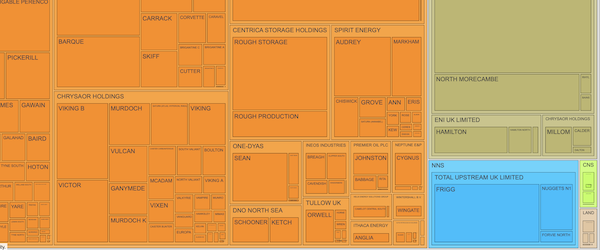
Production treemaps
Interactive treemaps summarize the cumulative oil and gas production on the UK Continental Shelf from its beginnings in 1975 to present day, using data from the UK Oil and Gas Authority PPRS database.
Usage: Click on the cells to drill down into the hierarchy of field areas, operators, and fields. Click on an enclosing cell to navigate back up the hierarchy. Hover to see the contribution of each cell to the overall cumulative production.
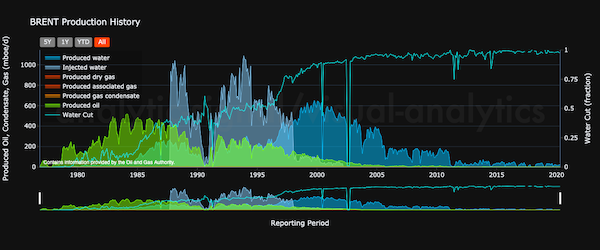
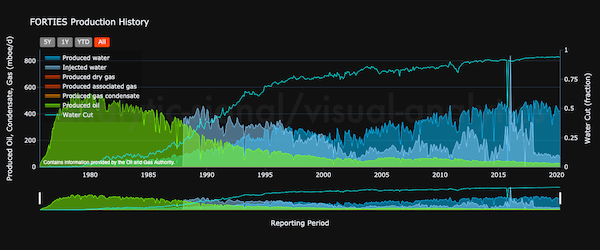
Production history
Interactive production time series summarize the history of oil production, produced and injected water, in giant oil fields on the UK Continental Shelf using data from the UK Oil and Gas Authority PPRS database.
Usage: Click on legend items to hide/show different production time series. Use the lower range sliders to focus on a specific time interval. Hover over the time series to see the monthly production figures for any particular month.
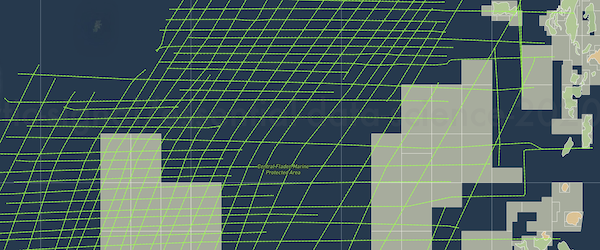
Geospatial data
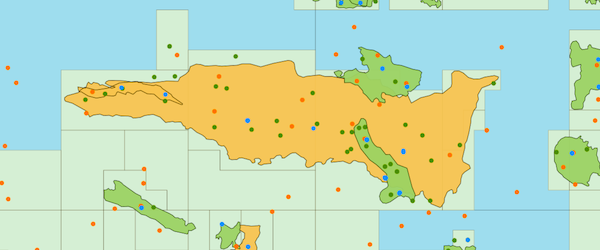
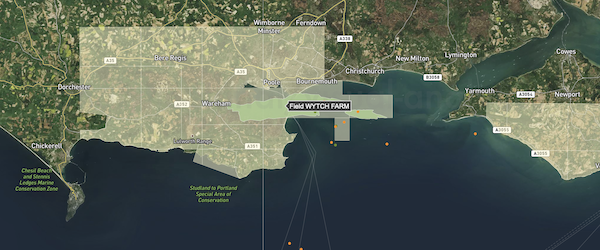
UKCS Oil & Gas Basemap
Interactive basemaps combine background Mapbox cultural and satellite imagery data with UKCS quadrants, license blocks, field outlines and surface locations of all wells.
Usage: The map legend controls the visibility of map elements; click on legend items to peel away map layers. Hover over map elements to see more information. Pan, tilt, zoom the map using the following mouse actions (or trackpad equivalents): pan = left-click+drag, tilt = right-click+drag, zoom = scroll wheel.
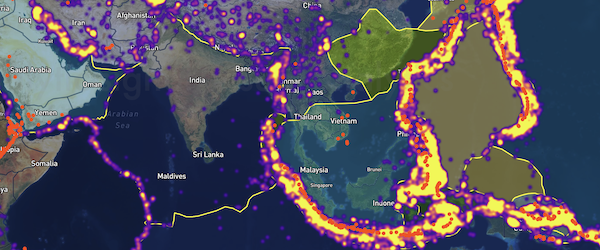
Earthquakes, volcanoes and plate tectonics
Explore global plate tectonics, volcanoes, and seismicity with these interactive maps drawn from USGS, Smithsonian, and BGS databases. Seismicity is represented with a multiresolution heatmap which displays global patterns and local detail depending on zoom level.
Usage: The map legend controls the visibility of map elements; click on legend items to peel away map layers. Hover over map elements to see more information. Pan, tilt, zoom the map using mouse actions (see Geospatial usage).
Wireline logs
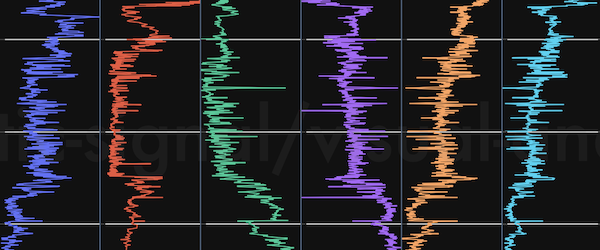
Wireline log viewer and scatterplot
Log viewer is a composition of multiple linked tracks, using well logs from an exploration well in the Central North Sea drawn from the UK National Data Repository.
Usage: The log viewer supports synchronized pan and zoom across multiple tracks. Switch between pan and zoom modes using the toolbar. Hover over data points to see more information.
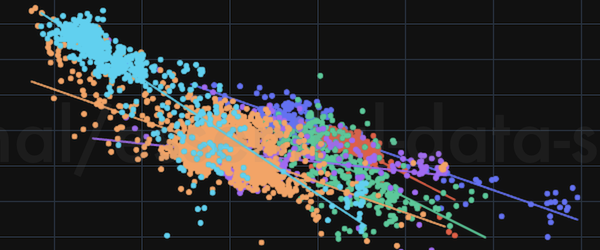
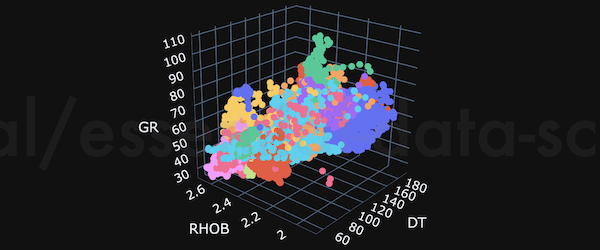
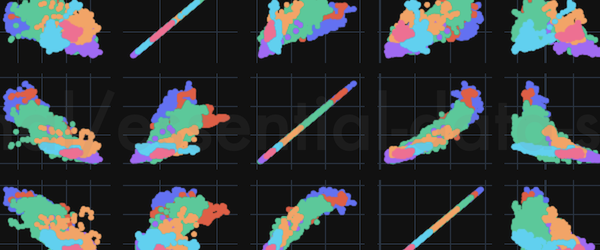
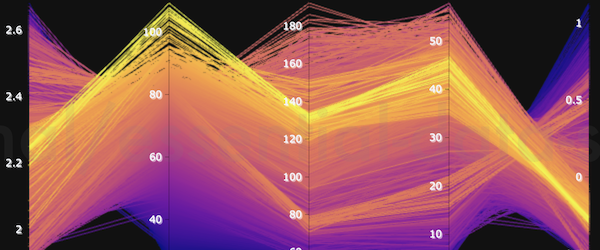
Multivariate Visualization
Multivariate statistical graphics enable exploration of the relationships between many variables at the same time.
Usage: The plot legend controls the visibility of plot elements; click on legend items to peel away data grouped by stratigraphic group and formation. Hover over data points to see more information. Switch between pan and zoom modes using the toolbar.
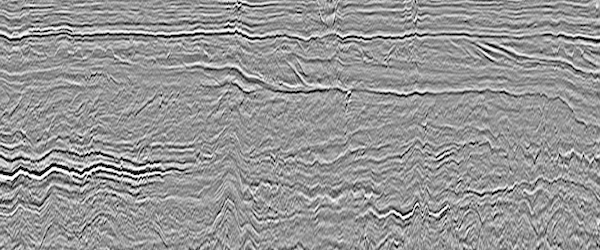
Seismic data
Seismic Lines and Location Maps
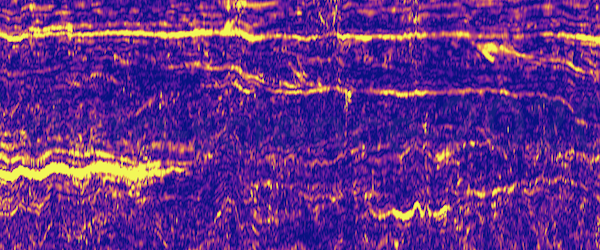
Explore a 2d seismic survey with this interactive cross-section and location map drawn from the East Shetland Platform 2d survey. Seismic trace data is displayed with performant WebGL graphics which enables interactive rendering of over 10,000 traces in this sample. The survey location map shows CDP locations extracted from SEG_Y trace headers, and reuses the UKCS basemap (see above) for the underlying oil and gas data.
Usage: Pan and zoom the cross-section to examine the data. Hover to see position and trace value information. Switch between pan and zoom modes using the toolbar.
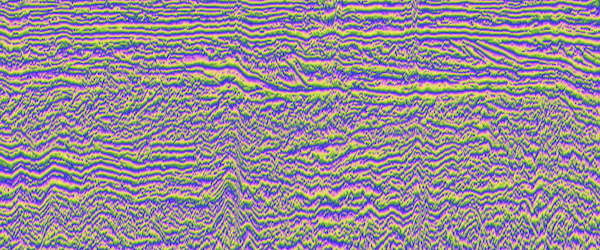
Instantaneous Attributes
Access to seismic trace data enables almost trivial computation of instantaneous attributes, such as reflection strength and instantaneous phase, thanks to Python's scipy signal processing package.
Usage: Same as seismic cross-section (see Seismic Full-stack Amplitude usage).